VDA5050 LIF Editor Refactoring
Performance Issues and Solution Search
I had been wanting to do refactoring on the LIF editor for a long time because I had changed so many things since I first started developing it. At the same time, the graph visualizer, which is actually the most important component of the project, was not providing sufficient performance after a certain number of nodes, which is normal because I was using a library called vue graph-network. Although it created nice animated edges for small maps, problems increased significantly with 1000 nodes and above. I started doing some research on this.
Technology Choice: OpenLayers
I had extensive experience with Leaflet before, I could have used Leaflet directly, but Leaflet hasn’t been getting much support for a long time (one clear reason for this is the Russia-Ukraine war, unfortunately Leaflet was a project that Ukrainian developers supported a lot), and new technologies require webgl and webgpu. After that, 2 options remained: OpenLayers or open-libre-gl.
OpenLayers is older so there’s much more content available, it’s easier to consume, while open-libre-gl supports webgpu. I wanted to stay on the side with more community, i.e., the safe side, and the fact that my problem could be solved with just webgl + webgpu not being supported especially on Linux devices was also effective in making this decision.
OpenLayers Integration and Optimizations
After that, I entered a laborious change process because using OpenLayers directly didn’t solve all my performance problems right away.
WebGL VectorLayer Transition
First, I used VectorLayer to show nodes and edges and the result was disappointing. Although the LIF file’s loading time decreased, as the number of edges and nodes in the view increased, visible performance problems continued. When I tried again with WebGLVectorLayer, there was a noticeable increase in performance. Unfortunately, I hadn’t recorded this later, but it could drop to 10 fps, however with WebGLVectorLayer this problem was completely solved. When transitioning to WebGL, I couldn’t directly move edges to the webgl layer because I needed not just a line but also an arrow, so I had to create 2 different layers, but the problem is now solved.
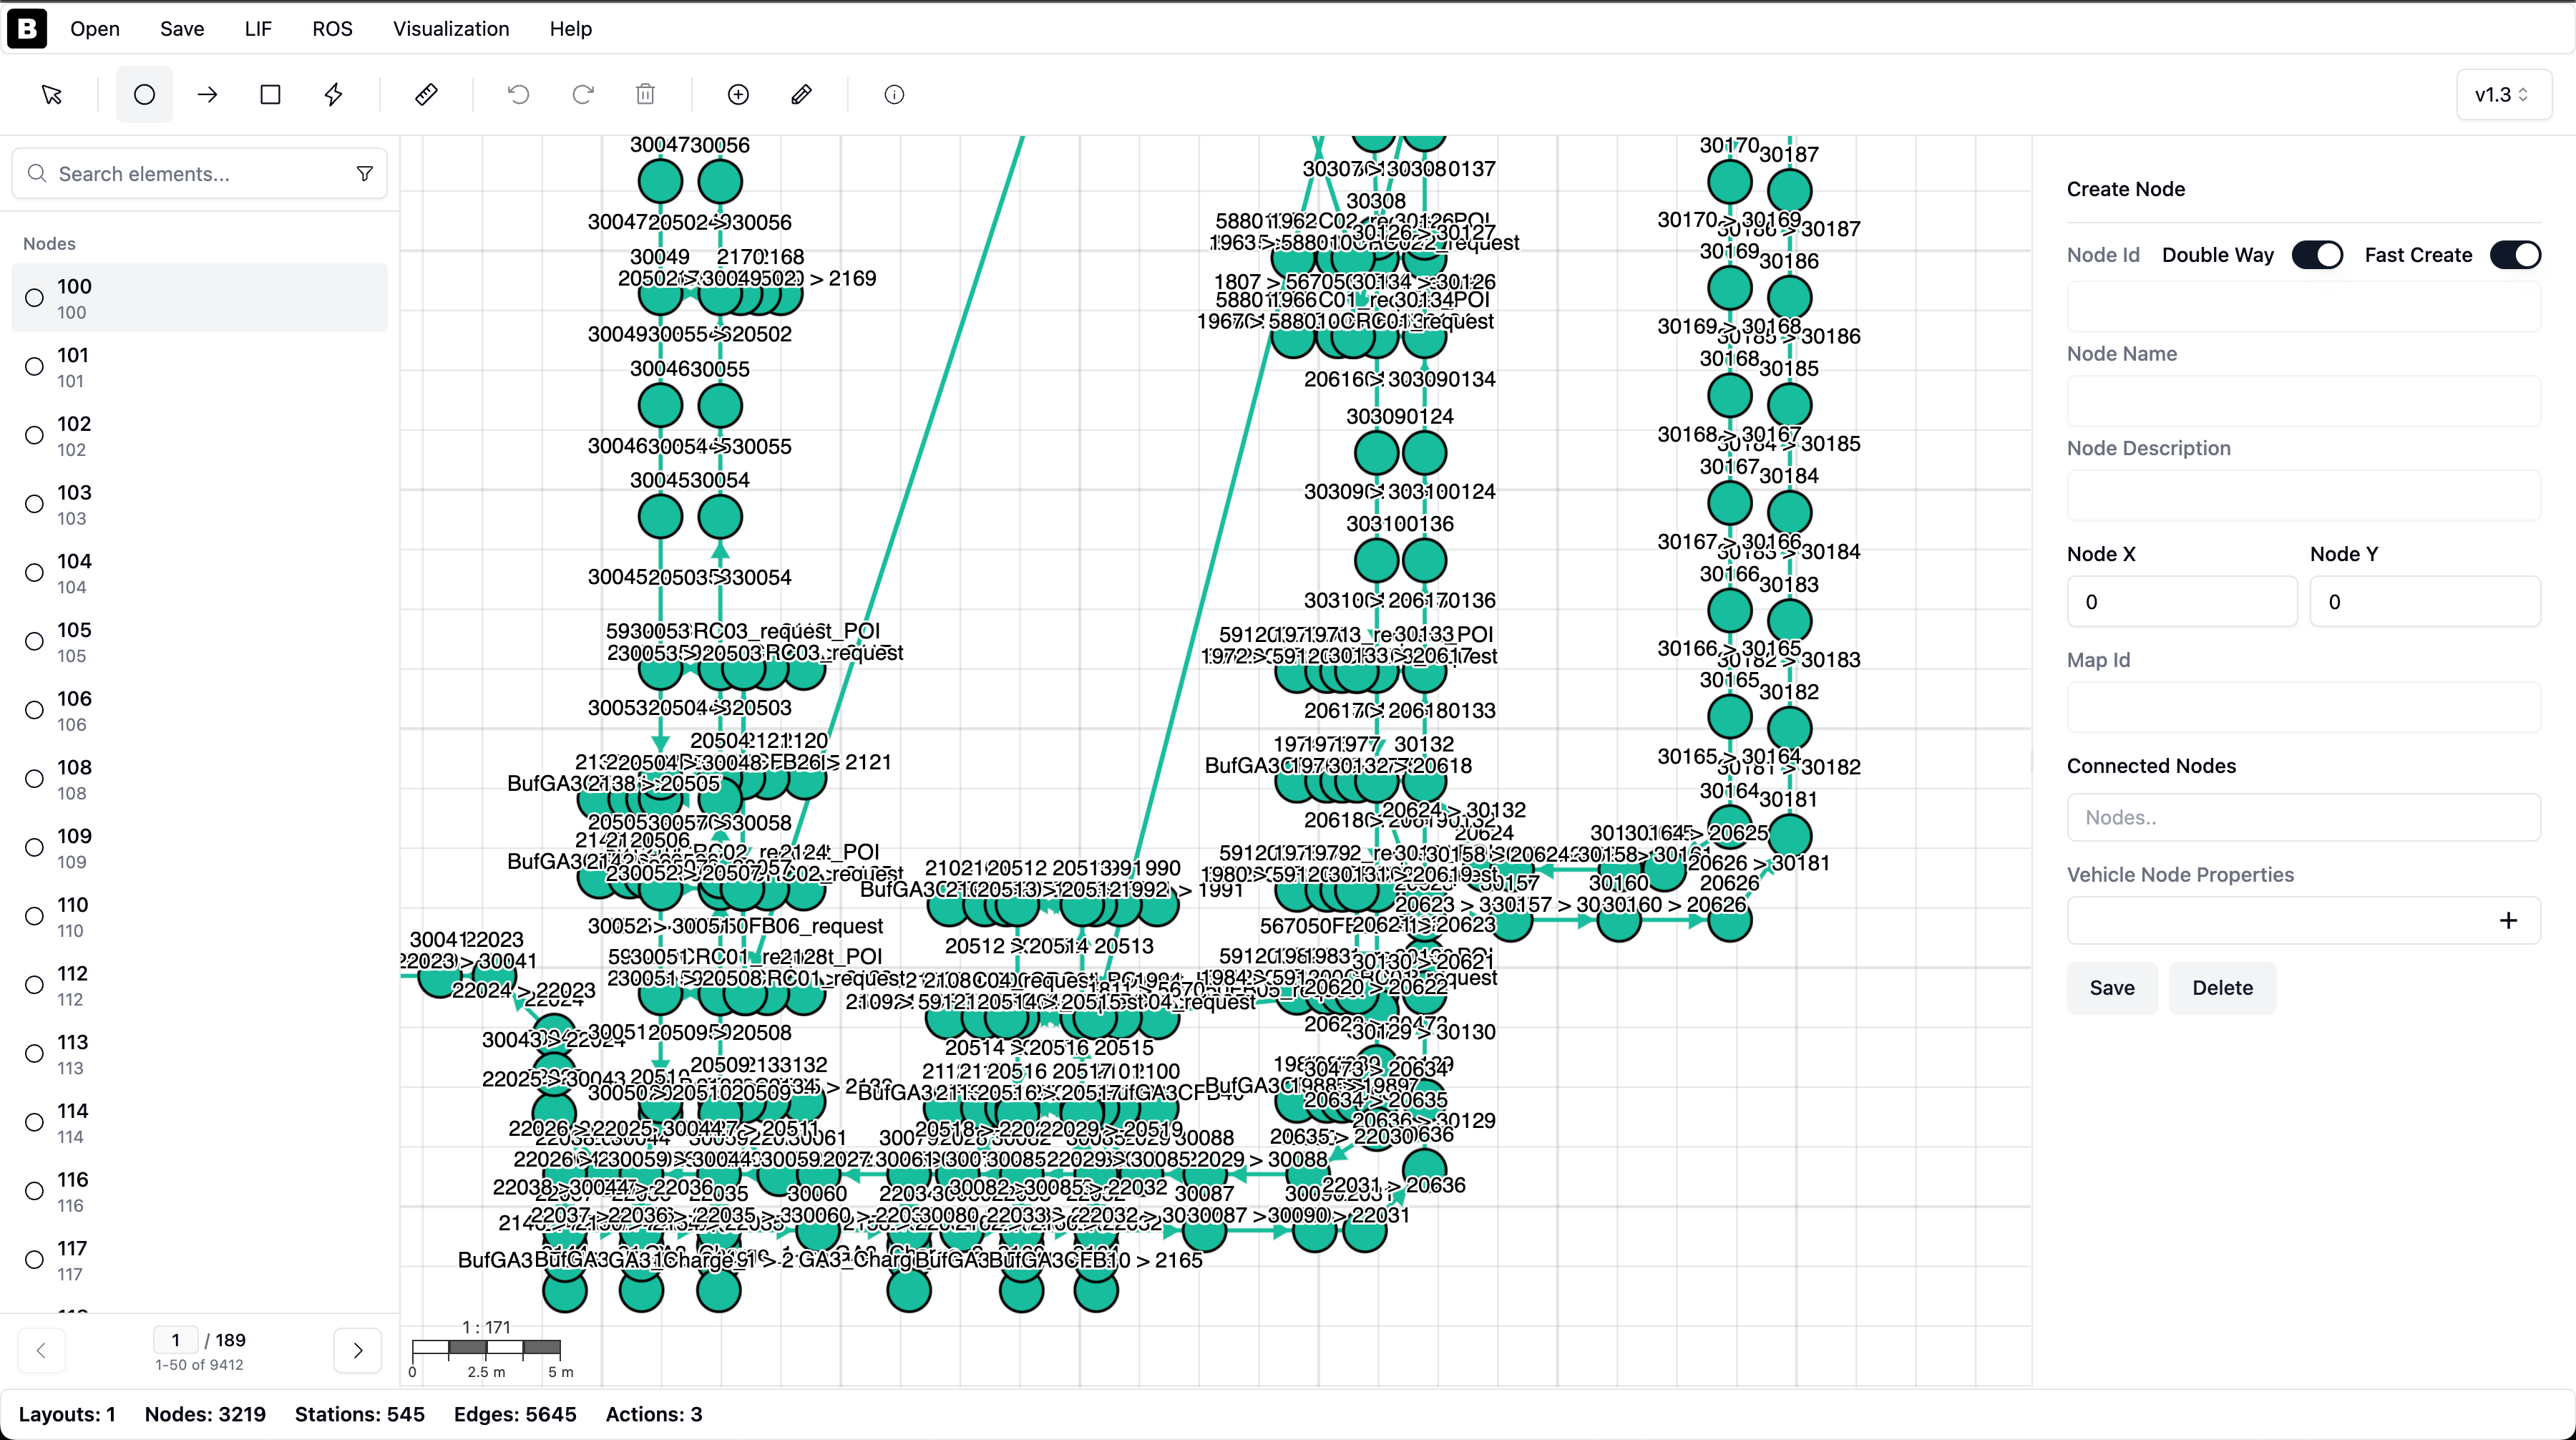
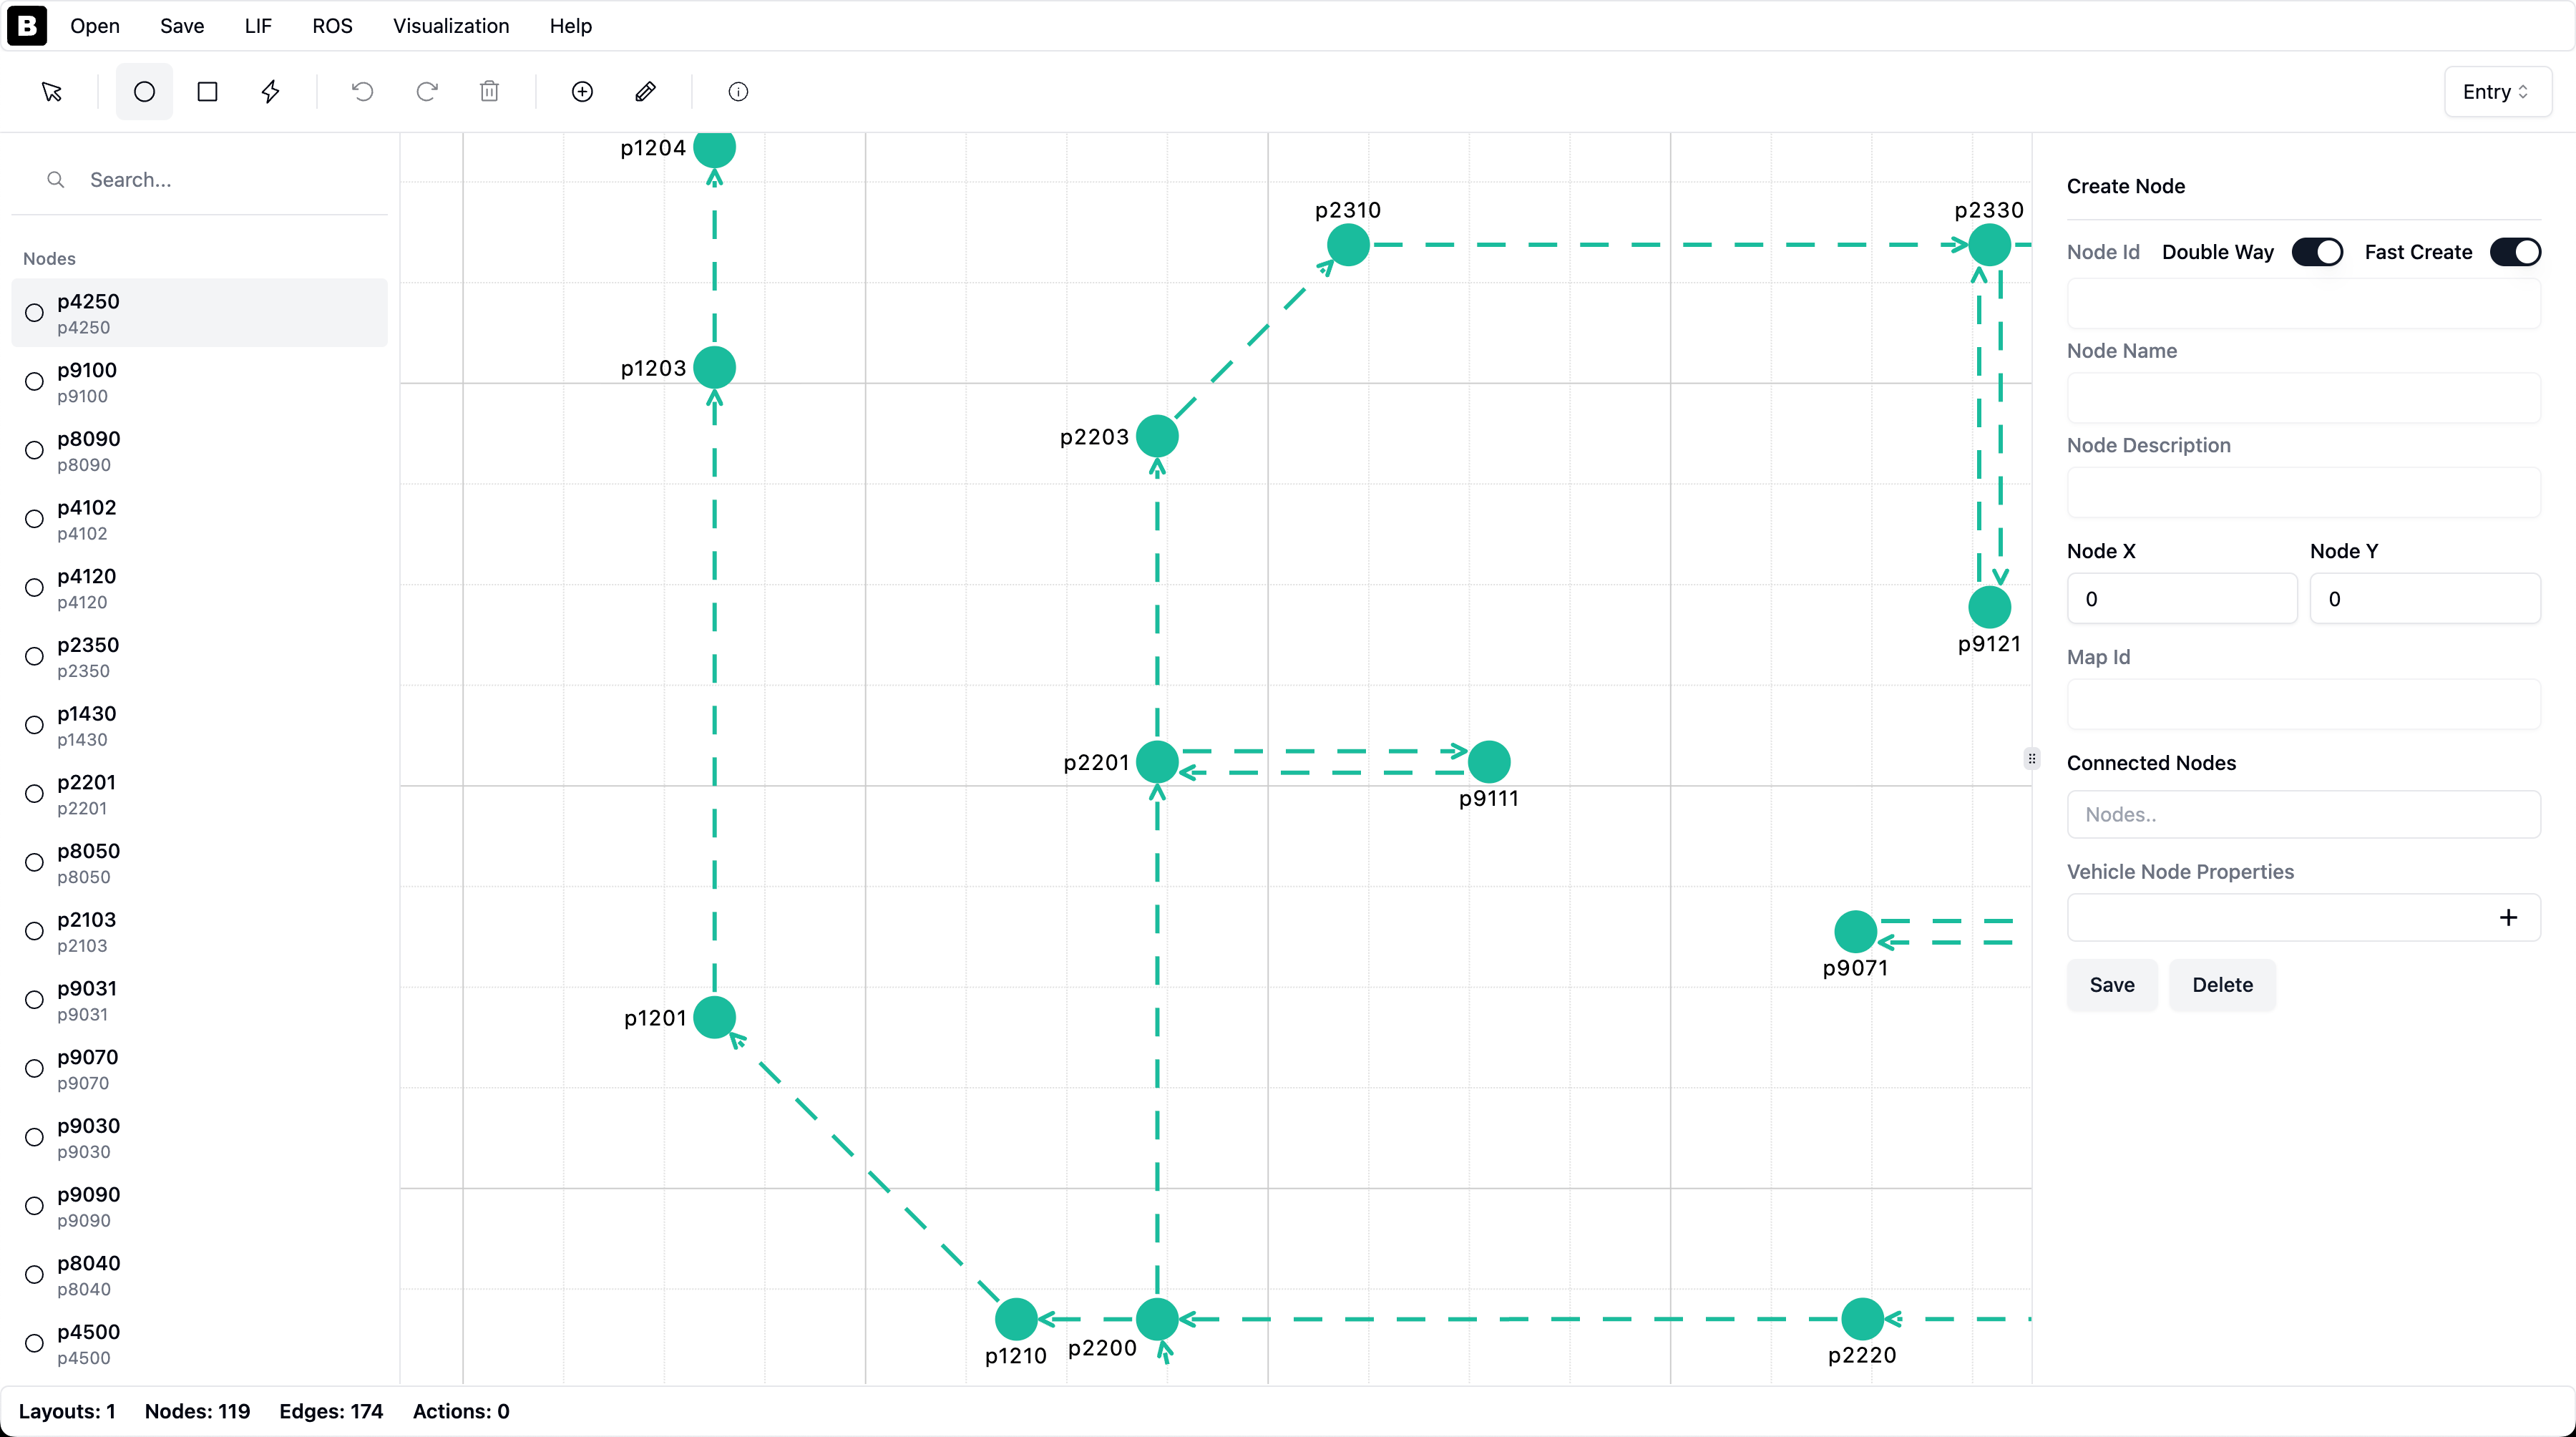
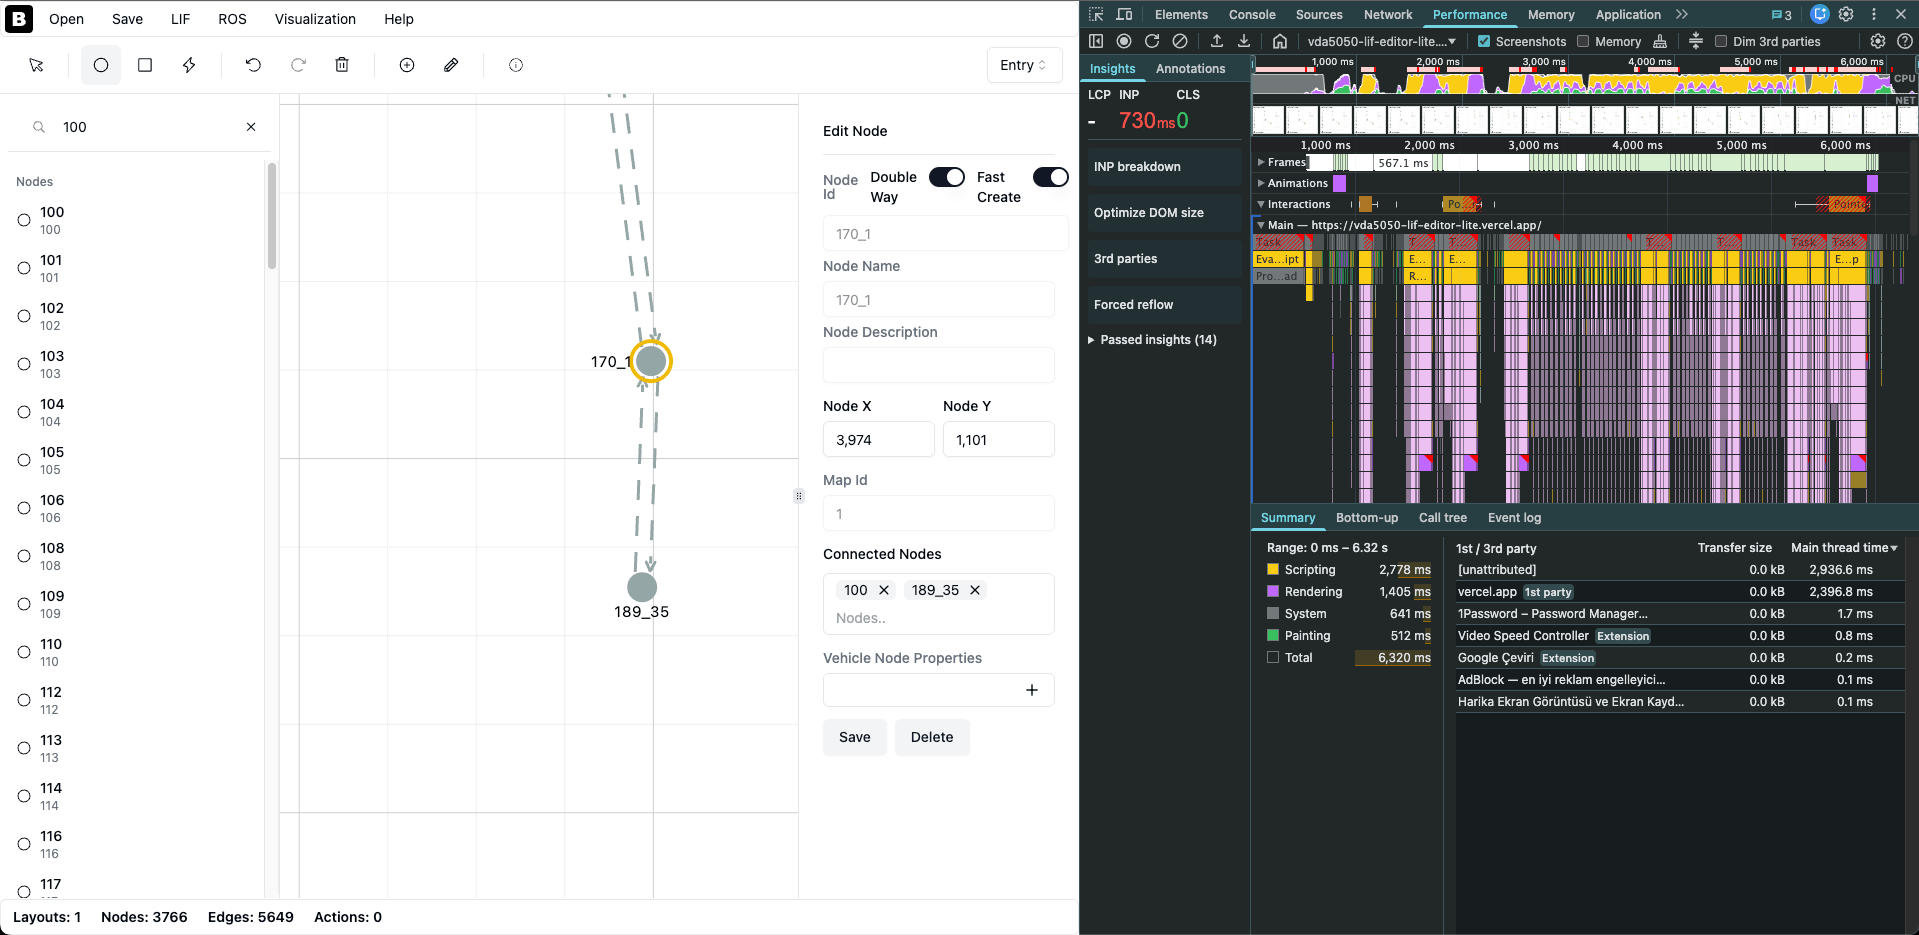
Performance Comparison
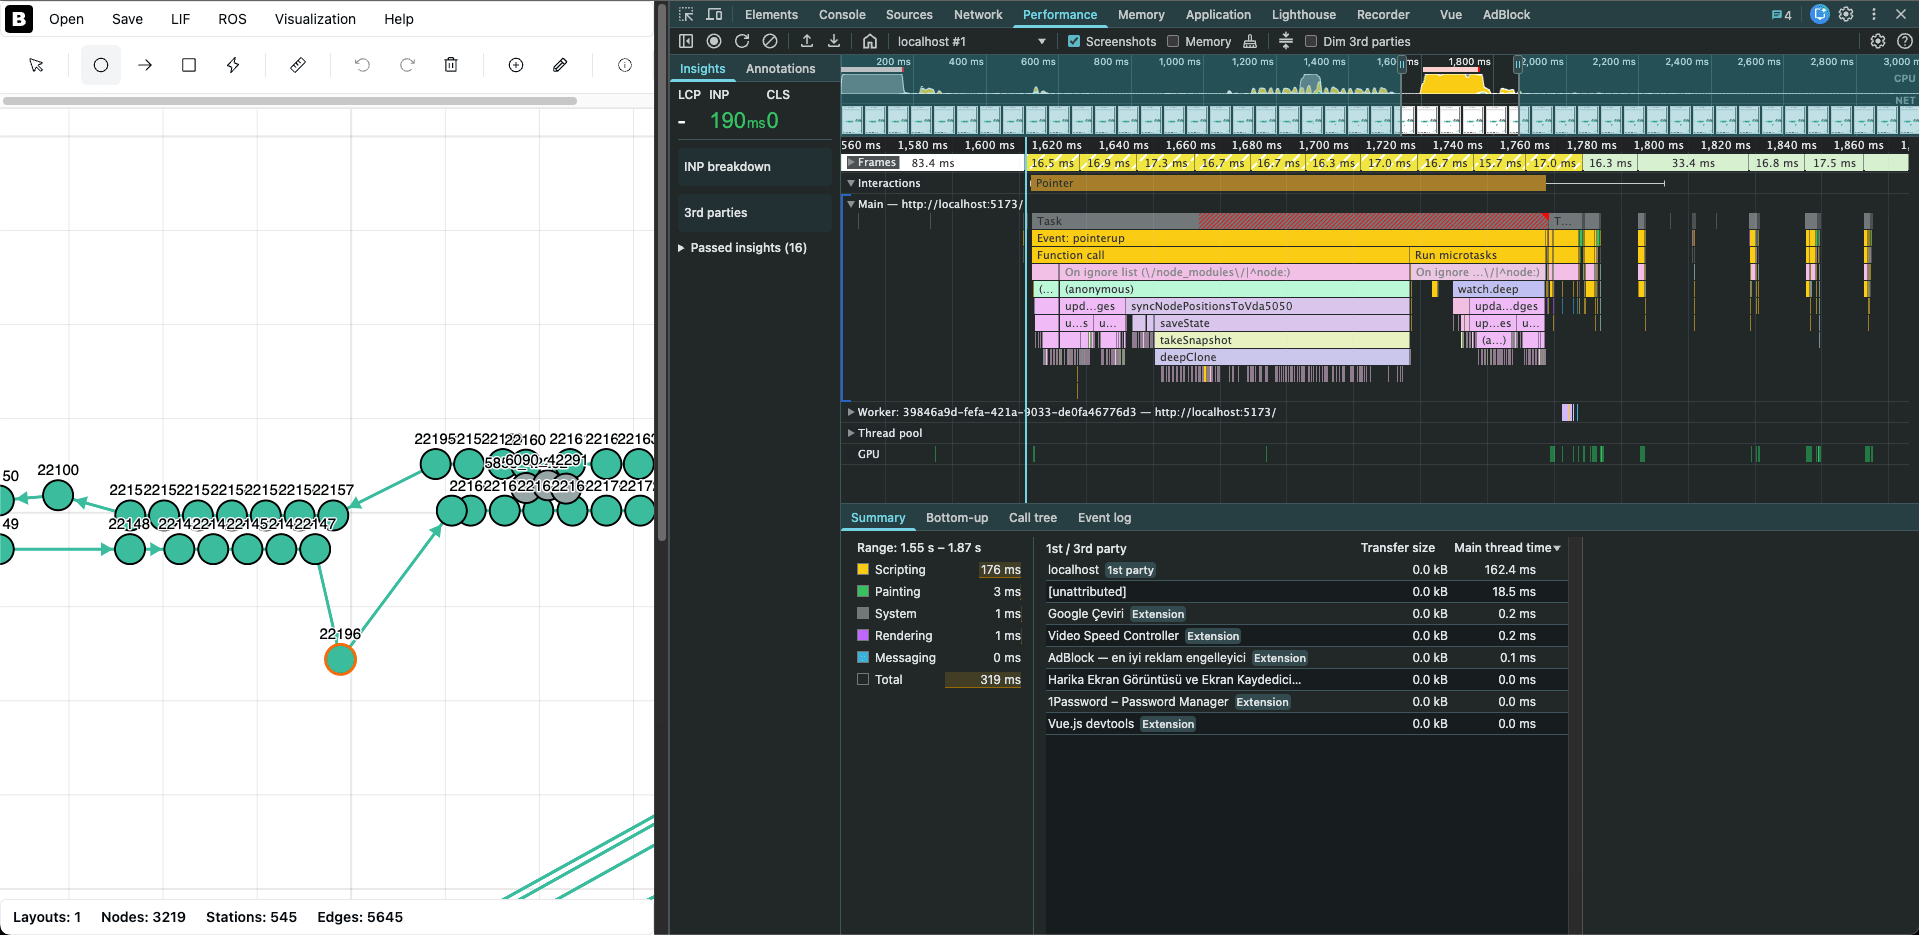
The images below clearly demonstrate the performance difference between the old and new versions:
Zoom and Drag Optimizations
Another tricky point was the operations during zoom and drag processes. During this time, node and edge labels were causing problems because texts were still on non-webgl layers. I had to do clustering on this, but I started this operation after waiting 100 ms after the zoom operation finished, so clustering didn’t run every second while zooming.
The same applies to grid lines, I waited for the operation to finish with debounce time until the zoom operation ended.
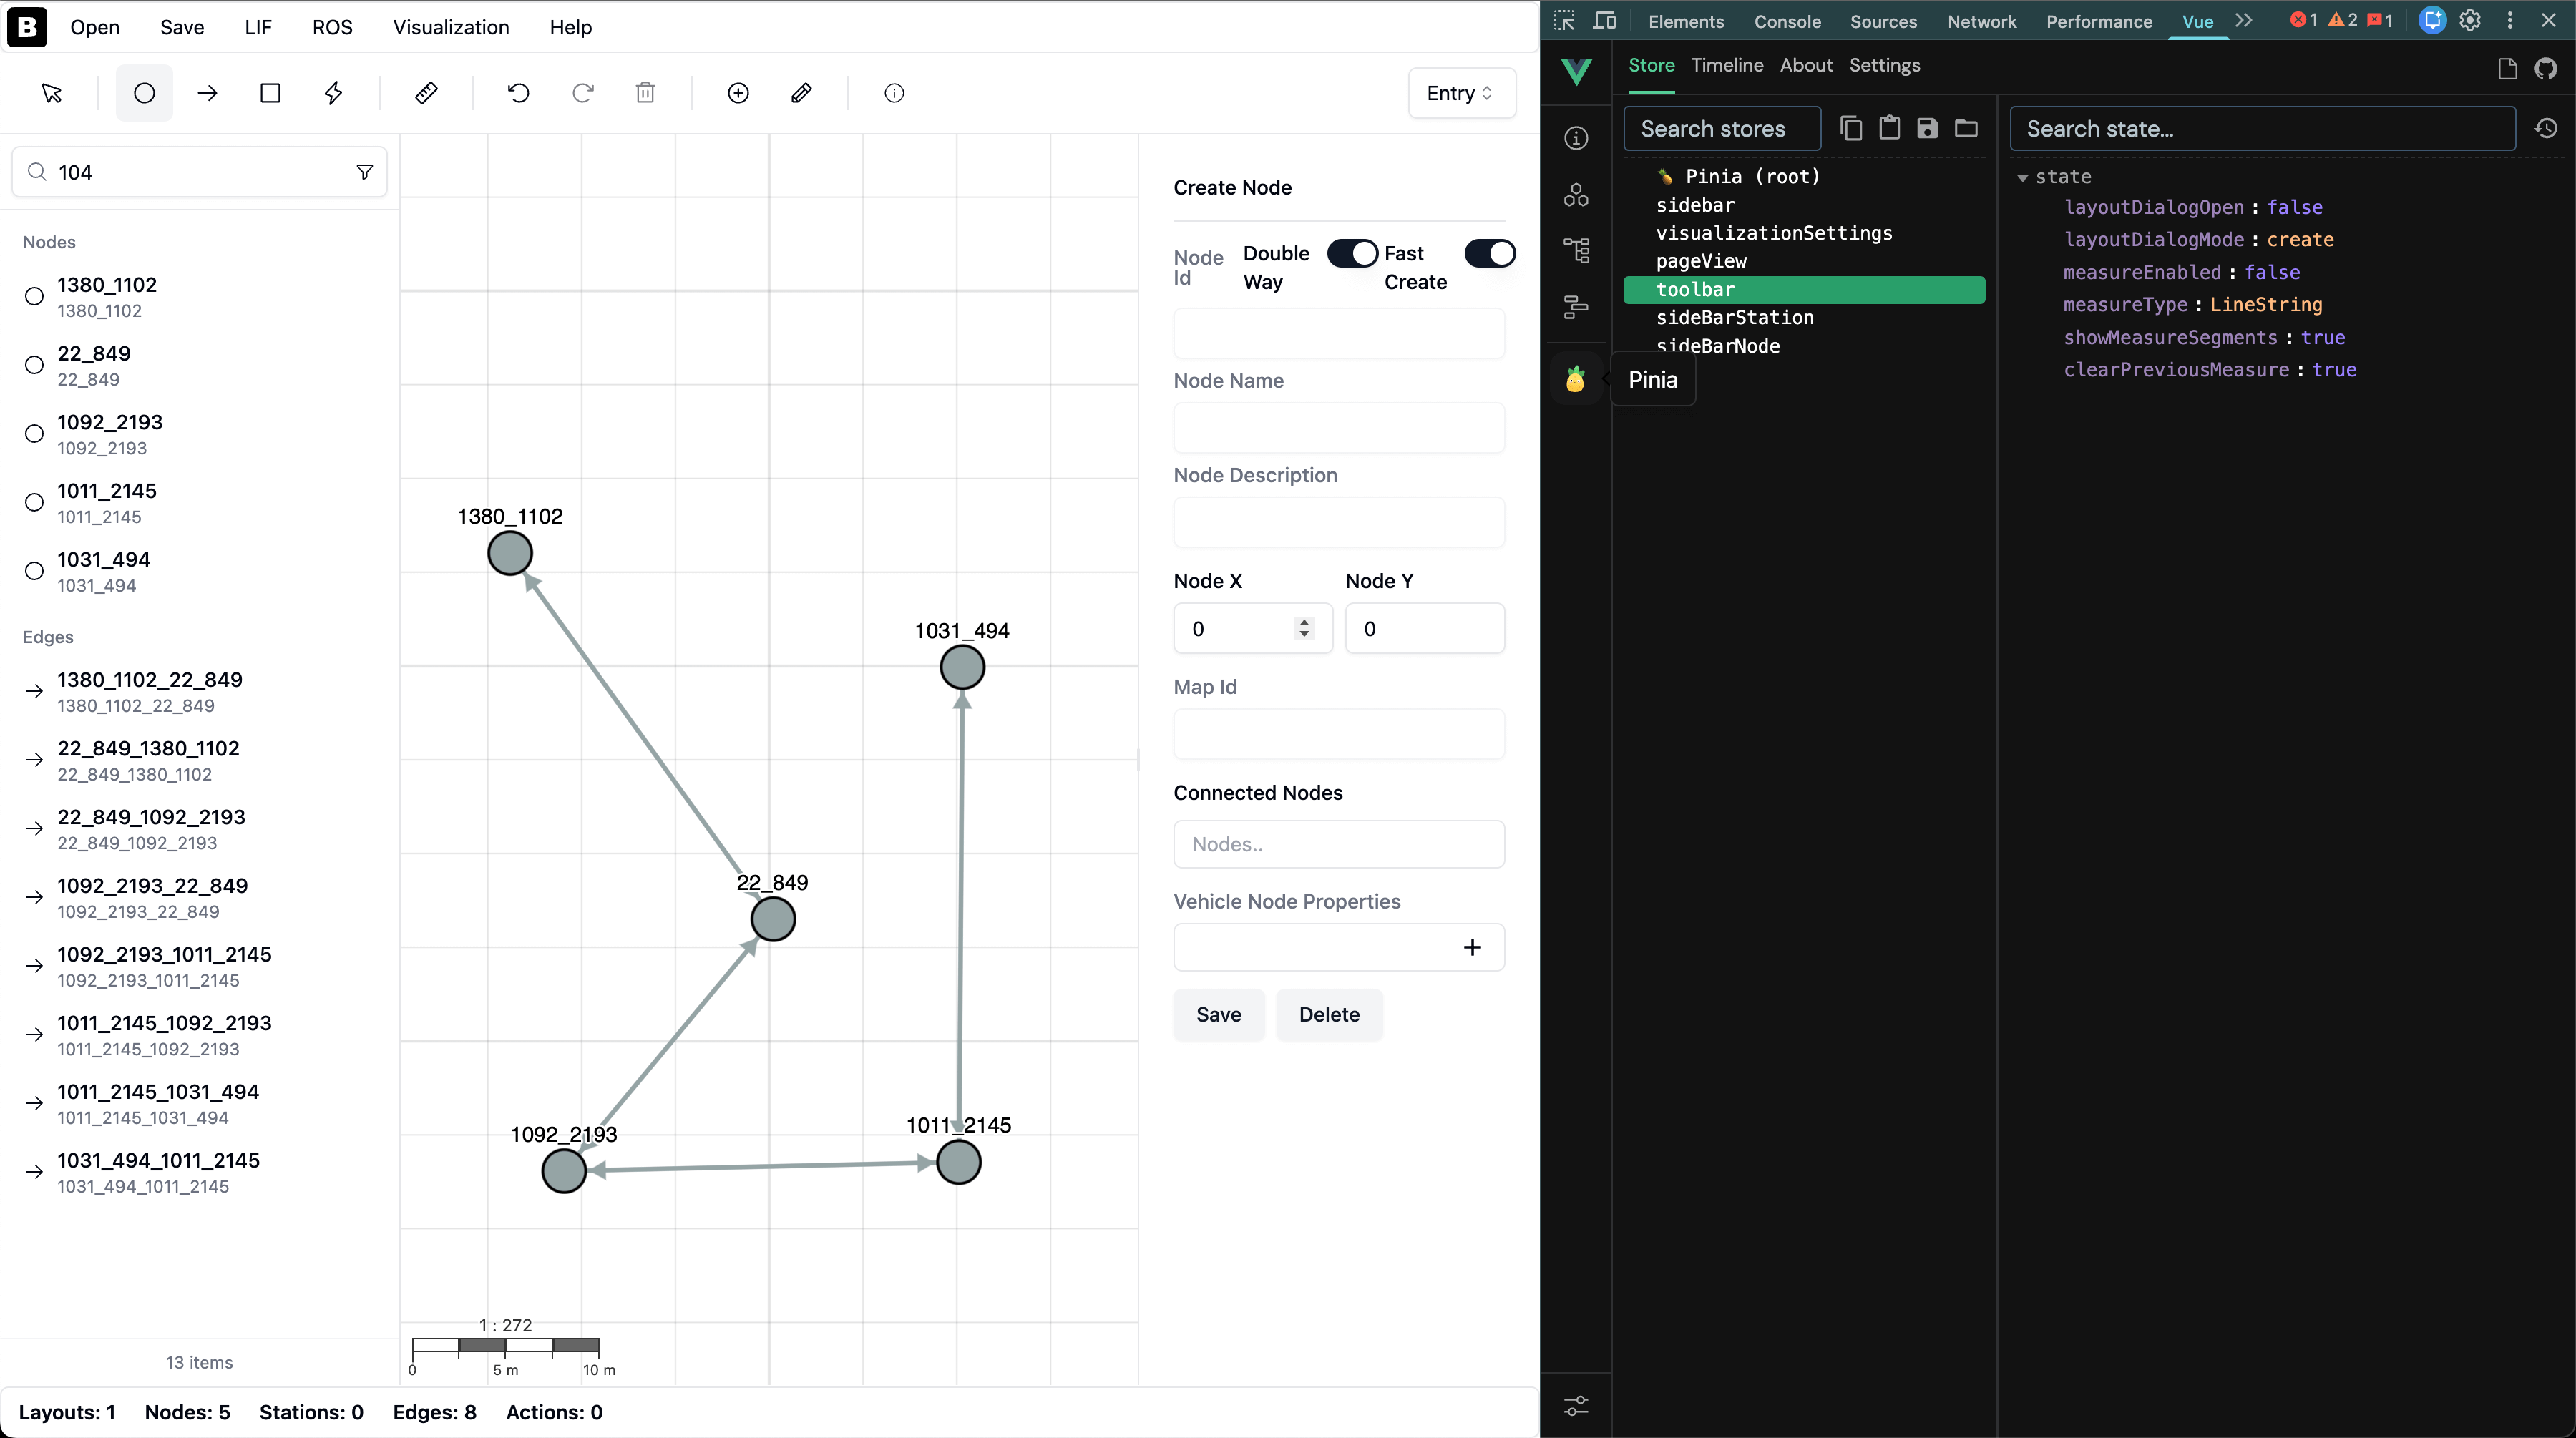
State Management: Transition to Pinia
Another change was transitioning to Pinia, thus getting rid of props drilling. At the beginning, since it was a very small project, I didn’t think it would be very necessary, but at the end of the day, a situation arose where I needed to access many states from the toolbar to both sidebars and the map view. I think I created a structure that can be debugged more easily with Pinia. Of course, I created stores not just for the toolbar but also for visualization settings and other necessary places and started using Pinia.
Also, during refactoring, I created composables so that the code wouldn’t stay in a single dev vue component.
Mobile Compatibility
After these changes, since I knew that large files didn’t work on phones before, I immediately tried it and yes, now large files open quite comfortably on phones too :D though I don’t know who would be in such a hurry to prepare a LIF file from their phone.
Additional Improvements
Map Element List Optimization
The left map element list wasn’t working performantly enough when there were too many items, so I used pagination instead and made it show only 50 items. This helped me with initialization time.
I also added a filtering feature to the map element list so you can list only stations or actions and then search.
JSON Visualization Improvement
Another major change was regarding json visualization. I should have done this from the beginning actually, but it was forgotten. The vue-json-pretty I was using already supported virtualization, but I hadn’t configured it. That’s why it was trying to create a very large json and the dom was taking too long. With a small change, I gained huge performance for large files.
New Features
- I saw the measure option as an example with OpenLayers and thought this would also be a useful feature.
- I created a dialog for the help section and added a simple tutorial section.
Conclusion
Along with these changes, I decided one more thing: the project will continue to remain open-source in its old form, but in its new form, I will continue to support it only as free-to-use.